| Overall | 14W 7L 0T |
| District | 8W 2L 0T |
| Expected | 13: 7+ 0- |
":" = Games won or lost as expected,
"+" = Games won against stronger team,
"-" = Games lost against weaker team)
|
30 9 3 Rank in State, Class, District |
1055 -91 Strength Momentum |
1093 52.2(28) SOS, RPI(RPI Rank) |
":" = Games won or lost as expected, "+" = Games won against stronger team, "-" = Games lost against weaker team) | |
| Date | Opponent1 | RGWF4 | Opp Strength | Result | Expectation2 | Playing Strength | P(Win)3 | Send |
|---|---|---|---|---|---|---|---|---|
| 08/18/15 | at Gadsden | 0.000 | 1030 | W 3- 0 | Expected (+3) | 1204 | 50% |  |
| 08/25/15 | at Alamogordo ?? | 0.000 | 1050 | L 0- 1 | Expected (-1) | 1014 | 47% | |
| 08/28/15 | Deming | 0.000 | 1136 | W 5- 0 | Better (+6) | 1336 | 43% | |
| 08/29/15 | Onate | 0.000 | 1183 | W 1- 0 | Better (+2) | 1157 | 38% | |
| 08/29/15 | at Mayfield !! | 0.000 | 1360 | W 1- 0 | Better (+4) | 1269 | 18% | |
| 09/04/15 | Hobbs | 0.002 | 1280 | L 0- 1 | Expected (+1) | 1106 | 28% | |
| 09/08/15 | Deming ! | 0.002 | 1136 | W 6- 0 | Better (+7) | 1388 | 43% | |
| 09/10/15 | at Aztec | 0.003 | 1155 | L 0- 6 | Expected (-5) | 812 | 35% | |
| 09/11/15 | at Carlsbad | 0.006 | 1258 | L 1- 2 | Expected (+1) | 1118 | 26% | |
| 09/12/15 | Mayfield | 0.007 | 1360 | W 2- 1 | Better (+4) | 1246 | 21% | |
| 09/22/15 | Los Lunas ? | 0.026 | 1093 | L 1- 4 | Expected (-3) | 912 | 48% | |
| 09/26/15 | at Chaparral | 0.030 | 980 | W 5- 0 | Expected (+4) | 1281 | 56% | |
| 09/29/15 | Valencia | 0.088 | 1086 | W 2- 0 | Better (+2) | 1159 | 49% | |
| 10/03/15 | at Belen | 0.124 | 975 | W 3- 1 | Expected (+1) | 1126 | 57% | |
| 10/06/15 | Santa Teresa | 0.199 | 923 | W 3- 2 | Expected (-1) | 1027 | 67% | |
| 10/10/15 | at Los Lunas | 0.214 | 1093 | W 4- 1 | Better (+4) | 1236 | 42% | |
| 10/13/15 | Chaparral | 0.191 | 980 | W 6- 0 | Expected (+5) | 1310 | 61% | |
| 10/17/15 | at Valencia | 0.498 | 1086 | L 2- 3 | Expected (0) | 1032 | 43% | |
| 10/20/15 | Belen | 975 | F 1--1 | Forfeit +1 | --- | 62% | | |
| 10/24/15 | at Santa Teresa | 0.625 | 923 | W 2- 0 | Expected (+1) | 1101 | 63% | |
| 10/31/15 | Los Lunas | 0.870 | 1093 | L 0- 1 | Expected (-1) | 1012 | 48% | |
|
Notes: 1Games against an opponent in the same district are shown in bold letters; may NOT be an actual district game Numbers in parentheses for reported games are the goals Centennial actually scored, relative to what ratings predicted 2Numbers listed for unreported/future games are the most probable winning margin 3P(Win) is the expected winning Percentage -- the statistical success rate for predicting the game winner between teams of this strength difference 4RGWF is the relative weight factor for this game * Game at a neutral site, or unable to determine which team gets home field advantage |
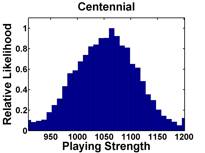
The median opponent strength is 1093, while
Centennial's "weighted playing strength" is 1084
(where a win by 4 goals counts 0.69 as much as a 1 goal win, and
a game played on 10/17/15 counts 0.5 that of one played on 11/07/15)
Go back to ratings for Boys Varsity Girls Varsity Main Page