| Overall | 7W 12L 1T |
| District | 2W 6L 0T |
| Expected | 11: 1+ 8- |
":" = Games won or lost as expected,
"+" = Games won against stronger team,
"-" = Games lost against weaker team)
|
25 15 4 Rank in State, Class, District |
1136 264 Strength Momentum |
1040 40.4(55) SOS, RPI(RPI Rank) |
":" = Games won or lost as expected, "+" = Games won against stronger team, "-" = Games lost against weaker team) | |
| Date | Opponent1 | RGWF4 | Opp Strength | Result | Expectation2 | Playing Strength | P(Win)3 | Send |
|---|---|---|---|---|---|---|---|---|
| 08/18/15 | at Chaparral | 0.000 | 980 | W 4- 1 | Expected (+2) | 1220 | 65% |  |
| 08/20/15 | at Silver | 0.000 | 759 | W 2- 1 | Expected (-3) | 1009 | 83% | |
| 08/28/15 | at Centennial | 0.000 | 1055 | L 0- 5 | Worse (-6) | 854 | 57% | |
| 08/29/15 | Alamogordo | 0.000 | 1050 | L 0- 5 | Worse (-6) | 829 | 62% | |
| 08/29/15 | Gadsden ! | 0.000 | 1030 | W 3- 2 | Expected (0) | 1121 | 64% | |
| 09/05/15 | Alamogordo ? | 0.001 | 1050 | L 0- 6 | Worse (-7) | 777 | 62% | |
| 09/08/15 | at Centennial | 0.002 | 1055 | L 0- 6 | Worse (-7) | 803 | 57% | |
| 09/10/15 | Silver | 0.005 | 759 | T 1- 1 | Worse (-4) | 935 | 86% | |
| 09/12/15 | at Santa Teresa | 0.007 | 923 | L 1- 3 | Worse (-4) | 941 | 71% | |
| 09/15/15 | Chaparral | 0.012 | 980 | W 3- 1 | Expected (0) | 1146 | 70% | |
| 09/16/15 | Santa Teresa ?? | 0.012 | 923 | L 3- 5 | Worse (-4) | 918 | 75% | |
| 09/22/15 | Gadsden | 0.036 | 1030 | W 2- 1 | Expected (0) | 1121 | 64% | |
| 09/24/15 | at Hatch | 0.045 | 665 | W 2- 1 | Expected (-3) | 962 | 89% | |
| 09/26/15 | at Mayfield !! | 0.053 | 1360 | W 2- 0 | Better (+4) | 1360 | 25% | |
| 09/29/15 | at Onate | 0.091 | 1183 | L 2- 3 | Expected (0) | 1121 | 42% | |
| 10/01/15 | Las Cruces | 0.099 | 1308 | L 0- 2 | Expected (-1) | 1110 | 34% | |
| 10/08/15 | at Gadsden | 0.242 | 1030 | L 1- 2 | Worse (-2) | 1044 | 59% | |
| 10/13/15 | Mayfield | 0.275 | 1360 | L 1- 4 | Expected (-1) | 1086 | 29% | |
| 10/17/15 | Onate | 0.425 | 1183 | L 0- 2 | Expected (-2) | 1048 | 47% | |
| 10/24/15 | at Las Cruces | 0.733 | 1308 | L 0- 1 | Expected (+1) | 1184 | 30% | |
|
Notes: 1Games against an opponent in the same district are shown in bold letters; may NOT be an actual district game Numbers in parentheses for reported games are the goals Deming actually scored, relative to what ratings predicted 2Numbers listed for unreported/future games are the most probable winning margin 3P(Win) is the expected winning Percentage -- the statistical success rate for predicting the game winner between teams of this strength difference 4RGWF is the relative weight factor for this game * Game at a neutral site, or unable to determine which team gets home field advantage |
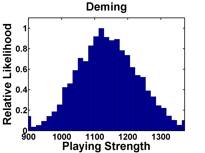
The median opponent strength is 1040, while
Deming's "weighted playing strength" is 1114
(where a win by 4 goals counts 0.69 as much as a 1 goal win, and
a game played on 10/17/15 counts 0.5 that of one played on 11/07/15)
Go back to ratings for Boys Varsity Girls Varsity Main Page