| Overall | 13W 8L 0T |
| District | 7W 3L 0T |
| Expected | 17: 3+ 1- |
":" = Games won or lost as expected,
"+" = Games won against stronger team,
"-" = Games lost against weaker team)
|
38 12 3 Rank in State, Class, District |
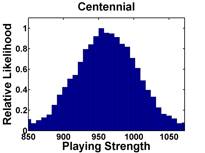
961 41 Strength Momentum |
961 52.9(27) SOS, RPI(RPI Rank) |
":" = Games won or lost as expected, "+" = Games won against stronger team, "-" = Games lost against weaker team) | |
| Date | Opponent1 | RGWF4 | Opp Strength | Result | Expectation2 | Playing Strength | P(Win)3 | Send |
|---|---|---|---|---|---|---|---|---|
| 08/18/15 | Gadsden | 0.000 | 1013 | L 1- 3 | Expected (-2) | 877 | 44% |  |
| 08/25/15 | at Alamogordo | 0.000 | 1005 | W 5- 3 | Better (+3) | 1093 | 39% | |
| 08/28/15 | Deming | 0.000 | 584 | W 3- 1 | Expected (-2) | 863 | 93% | |
| 08/29/15 | at Alamogordo | 0.000 | 1005 | W 2- 1 | Better (+2) | 1043 | 39% | |
| 08/29/15 | at Mayfield | 0.000 | 854 | W 5- 2 | Expected (+2) | 1068 | 64% | |
| 09/04/15 | Hobbs | 0.002 | 1286 | L 2- 3 | Expected (+2) | 1064 | 11% | |
| 09/08/15 | Deming | 0.000 | 584 | W 10- 0 | Expected (+6) | 1282 | 93% | |
| 09/10/15 | at Capital ? | 0.005 | 961 | L 1- 3 | Expected (-2) | 870 | 47% | |
| 09/11/15 | at Mayfield | 0.006 | 854 | W 2- 1 | Expected (0) | 967 | 64% | |
| 09/12/15 | Cleveland | 0.007 | 1236 | L 2- 3 | Expected (+2) | 1039 | 14% | |
| 09/22/15 | at Los Lunas | 0.034 | 931 | W 3- 2 | Expected (+1) | 1005 | 52% | |
| 09/26/15 | Chaparral | 0.062 | 972 | W 1- 0 | Expected (+1) | 1007 | 52% | |
| 09/29/15 | at Valencia | 0.085 | 1075 | L 1- 3 | Expected (-1) | 928 | 28% | |
| 10/06/15 | at Santa Teresa ?? | 0.186 | 902 | L 3- 5 | Worse (-2) | 841 | 57% | |
| 10/10/15 | Los Lunas ! | 0.205 | 931 | W 4- 0 | Expected (+4) | 1137 | 59% | |
| 10/13/15 | at Chaparral | 0.349 | 972 | L 1- 3 | Expected (-2) | 876 | 45% | |
| 10/15/15 | Belen | 0.093 | 593 | W 9- 1 | Expected (+4) | 1177 | 93% | |
| 10/17/15 | Valencia !! | 0.352 | 1075 | W 4- 0 | Better (+5) | 1210 | 34% | |
| 10/22/15 | at Belen | 0.039 | 593 | W 10- 0 | Expected (+7) | 1307 | 91% | |
| 10/24/15 | Santa Teresa | 0.727 | 902 | W 2- 1 | Expected (0) | 972 | 64% | |
| 10/30/15 | Goddard | 0.861 | 996 | L 0- 1 | Expected (-1) | 919 | 47% | |
|
Notes: 1Games against an opponent in the same district are shown in bold letters; may NOT be an actual district game Numbers in parentheses for reported games are the goals Centennial actually scored, relative to what ratings predicted 2Numbers listed for unreported/future games are the most probable winning margin 3P(Win) is the expected winning Percentage -- the statistical success rate for predicting the game winner between teams of this strength difference 4RGWF is the relative weight factor for this game * Game at a neutral site, or unable to determine which team gets home field advantage |
The median opponent strength is 961, while
Centennial's "weighted playing strength" is 987
(where a win by 4 goals counts 0.65 as much as a 1 goal win, and
a game played on 10/17/15 counts 0.5 that of one played on 11/07/15)
Go back to ratings for Boys Varsity Girls Varsity Main Page