| Overall | 12W 8L 2T |
| District | 6W 3L 1T |
| Expected | 15: 3+ 4- |
":" = Games won or lost as expected,
"+" = Games won against stronger team,
"-" = Games lost against weaker team)
|
37 11 2 Rank in State, Class, District |
972 -117 Strength Momentum |
916 53.5(25) SOS, RPI(RPI Rank) |
":" = Games won or lost as expected, "+" = Games won against stronger team, "-" = Games lost against weaker team) | |
| Date | Opponent1 | RGWF4 | Opp Strength | Result | Expectation2 | Playing Strength | P(Win)3 | Send |
|---|---|---|---|---|---|---|---|---|
| 08/18/15 | at Deming | 0.000 | 584 | W 2- 1 | Expected (-3) | 838 | 92% |  |
| 08/25/15 | Gadsden | 0.000 | 1013 | T 2- 2 | Better (0) | 983 | 46% | |
| 08/28/15 | at Mayfield ?? | 0.000 | 854 | L 1- 2 | Worse (-2) | 873 | 66% | |
| 08/29/15 | Las Cruces | 0.000 | 1152 | L 0- 1 | Expected (+1) | 1002 | 24% | |
| 08/29/15 | at Deming | 0.000 | 584 | W 9- 1 | Expected (+4) | 1198 | 92% | |
| 09/01/15 | Hatch ! | 0.000 | 1052 | W 7- 1 | Better (+7) | 1307 | 39% | |
| 09/03/15 | Onate ? | 0.001 | 859 | L 1- 2 | Worse (-2) | 856 | 71% | |
| 09/08/15 | at Gadsden | 0.003 | 1013 | L 1- 4 | Expected (-2) | 852 | 39% | |
| 09/12/15 | Silver | 0.001 | 870 | W 10- 0 | Expected (+9) | 1431 | 70% | |
| 09/15/15 | Deming | 0.010 | 584 | W 3- 0 | Expected (-1) | 919 | 93% | |
| 09/22/15 | Valencia !! | 0.033 | 1075 | W 2- 0 | Better (+3) | 1114 | 35% | |
| 09/26/15 | at Centennial | 0.062 | 961 | L 0- 1 | Expected (-1) | 926 | 48% | |
| 09/29/15 | Santa Teresa | 0.091 | 902 | T 1- 1 | Worse (-1) | 927 | 66% | |
| 10/03/15 | Los Lunas | 0.121 | 931 | W 5- 2 | Expected (+2) | 1092 | 61% | |
| 10/06/15 | Belen | 0.186 | 593 | W 4- 2 | Expected (-2) | 873 | 94% | |
| 10/10/15 | at Valencia | 0.288 | 1075 | L 2- 3 | Expected (0) | 983 | 29% | |
| 10/13/15 | Centennial | 0.349 | 961 | W 3- 1 | Expected (+2) | 1057 | 55% | |
| 10/17/15 | at Santa Teresa | 0.476 | 902 | W 1- 0 | Expected (0) | 997 | 59% | |
| 10/22/15 | at Los Lunas | 0.661 | 931 | L 1- 2 | Worse (-1) | 911 | 54% | |
| 10/24/15 | at Belen | 0.444 | 593 | W 4- 0 | Expected (0) | 994 | 92% | |
| 10/31/15 | Santa Teresa | 0.916 | 902 | W 1- 0 | Expected (0) | 977 | 66% | |
| 11/05/15 | * Albuquerque Academy | 0.561 | 1495 | L 1- 6 | Expected (0) | 991 | 3% | |
|
Notes: 1Games against an opponent in the same district are shown in bold letters; may NOT be an actual district game Numbers in parentheses for reported games are the goals Chaparral actually scored, relative to what ratings predicted 2Numbers listed for unreported/future games are the most probable winning margin 3P(Win) is the expected winning Percentage -- the statistical success rate for predicting the game winner between teams of this strength difference 4RGWF is the relative weight factor for this game * Game at a neutral site, or unable to determine which team gets home field advantage |
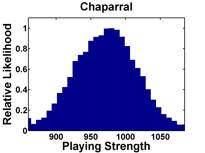
The median opponent strength is 916, while
Chaparral's "weighted playing strength" is 978
(where a win by 4 goals counts 0.65 as much as a 1 goal win, and
a game played on 10/17/15 counts 0.5 that of one played on 11/07/15)
Go back to ratings for Boys Varsity Girls Varsity Main Page