| Overall | 10W 8L 1T |
| District | 3W 3L 0T |
| Expected | 13: 0+ 6- |
":" = Games won or lost as expected,
"+" = Games won against stronger team,
"-" = Games lost against weaker team)
|
29 8 2 Rank in State, Class, District |
1074 135 Strength Momentum |
762 42.2(47) SOS, RPI(RPI Rank) |
":" = Games won or lost as expected, "+" = Games won against stronger team, "-" = Games lost against weaker team) | |
| Date | Opponent1 | RGWF4 | Opp Strength | Result | Expectation2 | Playing Strength | P(Win)3 | Send |
|---|---|---|---|---|---|---|---|---|
| 08/24/15 | at St. Michael's | 0.000 | 1262 | L 0-10 | Expected (-8) | 660 | 28% |  |
| 08/26/15 | Santa Fe Prep | 0.000 | 722 | W 6- 0 | Expected (+2) | 1190 | 85% | |
| 08/29/15 | Moriarty | 0.000 | 458 | W 3- 1 | Expected (-4) | 854 | 96% | |
| 09/01/15 | at Robertson | 0.001 | 615 | W 2- 1 | Expected (-3) | 906 | 89% | |
| 09/02/15 | at Santa Fe Indian | 0.001 | 762 | T 1- 1 | Worse (-3) | 929 | 79% | |
| 09/04/15 | Artesia ? | 0.001 | 674 | L 3- 5 | Worse (-6) | 762 | 88% | |
| 09/08/15 | Los Lunas | 0.003 | 1093 | L 0- 3 | Worse (-3) | 922 | 51% | |
| 09/14/15 | Monte del Sol | 0.010 | 752 | W 2- 1 | Expected (-2) | 952 | 83% | |
| 09/19/15 | Santa Fe | 0.020 | 984 | L 1- 3 | Worse (-3) | 917 | 63% | |
| 09/22/15 | Los Alamos | 0.017 | 1278 | L 0- 5 | Expected (-3) | 912 | 30% | |
| 09/23/15 | Desert Academy | 0.032 | 612 | W 4- 0 | Expected (-1) | 1033 | 91% | |
| 09/25/15 | Hatch ?? | 0.047 | 665 | L 1- 3 | Worse (-6) | 758 | 88% | |
| 09/26/15 | at Bernalillo ! | 0.059 | 958 | W 1- 0 | Expected (0) | 1078 | 61% | |
| 09/28/15 | Lovington | 0.077 | 270 | W 2- 0 | Expected (-6) | 761 | 98% | |
| 09/29/15 | Del Norte | 0.086 | 895 | L 2- 3 | Worse (-3) | 923 | 72% | |
| 10/01/15 | Pojoaque | 0.074 | 576 | W 5- 0 | Expected (0) | 1066 | 92% | |
| 10/10/15 | at Los Alamos | 0.149 | 1278 | L 0- 6 | Expected (-4) | 884 | 26% | |
| 10/13/15 | Bernalillo !! | 0.358 | 958 | W 2- 0 | Expected (+1) | 1104 | 66% | |
| 10/17/15 | at Del Norte | 0.425 | 895 | W 3- 1 | Expected (0) | 1096 | 68% | |
|
Notes: 1Games against an opponent in the same district are shown in bold letters; may NOT be an actual district game Numbers in parentheses for reported games are the goals Capital actually scored, relative to what ratings predicted 2Numbers listed for unreported/future games are the most probable winning margin 3P(Win) is the expected winning Percentage -- the statistical success rate for predicting the game winner between teams of this strength difference 4RGWF is the relative weight factor for this game * Game at a neutral site, or unable to determine which team gets home field advantage |
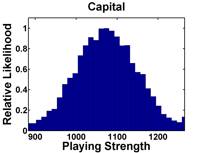
The median opponent strength is 762, while
Capital's "weighted playing strength" is 1023
(where a win by 4 goals counts 0.69 as much as a 1 goal win, and
a game played on 10/17/15 counts 0.5 that of one played on 11/07/15)
Go back to ratings for Boys Varsity Girls Varsity Main Page